
New Release v1.0.274: Redesigned Analytics Dashboard & Improved Task Switching
Introducing the completely redesigned Analytics Dashboard with Focus Score, Peak Hours Analysis, AI-powered Insights, and seamless task switching with confirmation dialogs.
#New Release v1.0.274: Redesigned Analytics Dashboard & Improved Task Switching
We're thrilled to announce iTracksy v1.0.274 featuring a completely redesigned Analytics Dashboard based on productivity research and user feedback. This update brings a smarter, more intuitive way to understand your work patterns!
#See It In Action
Watch the new Analytics Dashboard, Focus Sessions, and seamless task switching in action
#What's New
#1. Three-Layer Progressive Disclosure Analytics
We've completely redesigned the Analytics Dashboard based on the principle of Progressive Disclosure - showing you the right level of detail at the right time.
#Layer 1: The Pulse (Instant Feedback)
The new Focus Score gives you immediate feedback on your productivity:
- Single number (0-100) that tells you how your day is going
- Visual ring showing progress at a glance
- Status labels: Deep Work, Productive, Distracted, or Recovering
- Quick stats: Focus Time, Productivity %, Sessions count
The Focus Score is calculated from both your productivity percentage AND total focus time - rewarding both quality and quantity.
#Layer 2: Day Review (Tactical Insight)
Get a deeper understanding of your day with:
- Activity Timeline: Gantt-style visualization of your work blocks
- Top Apps: See which applications consumed your time
- Time by Project: Horizontal bar chart showing project breakdown
- Activity Heatmap: GitHub-style contribution graph
#Layer 3: Deep Dive (Strategic Analysis)
For those who want to optimize their productivity long-term:
- Focus Trends: Line chart with 7-day moving average
- Peak Hours Analysis: Discover your most productive hours
- Productivity Insights: AI-powered recommendations
#2. Peak Hours Analysis
Discover when you do your best work!
The new Peak Hours Analysis feature identifies:
- Your top 3 productive hours based on historical data
- Work style classification: Early Bird, Afternoon Focused, Evening Worker, Night Owl, or Balanced
- Time of day distribution: Morning, Afternoon, Evening, Night percentages
- Hourly breakdown chart: Visual representation of your work patterns
Use this data to schedule important tasks during your peak performance hours!
#3. AI-Powered Productivity Insights
Get actionable recommendations based on your actual work patterns:
| Insight Type | Example |
|---|---|
| Success | "You're improving! Focus time increased compared to last week" |
| Warning | "Short sessions detected - try the Pomodoro technique" |
| Tip | "20% of your work is late at night - this may affect sleep" |
Insights are automatically generated based on:
- Session length patterns
- Productivity percentages
- Time trends (comparing recent vs past performance)
- Work hour distribution
#4. Seamless Task Switching
No more error messages when switching tasks!
Previously, trying to start a new task while one was running showed an error. Now you get a friendly confirmation dialog:
- "Switch Task?" - Clear confirmation dialog
- One-click switch: Stop current task and start new one automatically
- Cancel option: Keep working on current task if you clicked by accident
This makes task switching much smoother when jumping between projects!
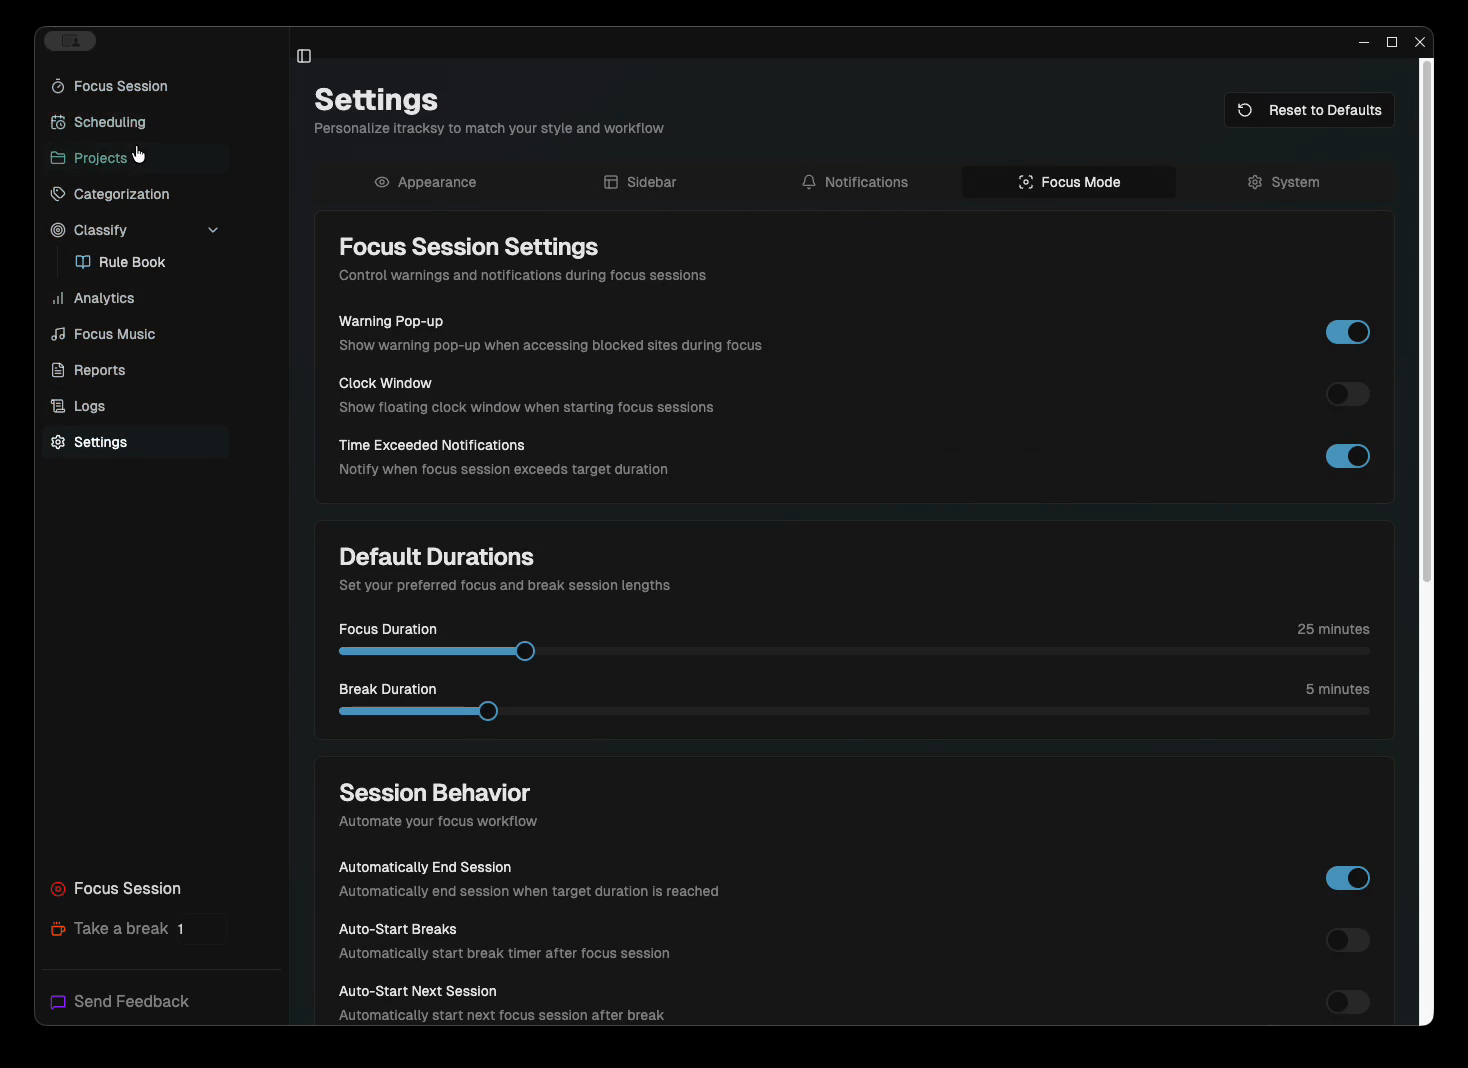
#5. Improved Unlimited Focus Mode
For unlimited focus sessions, we now show:
- Simple "Tracking" indicator instead of a counting timer
- Pulsing animation to show the session is active
- "Your activities are being recorded" message
Because showing elapsed time doesn't make sense when there's no target!
#Design Philosophy
This redesign follows key UX principles:
- Progressive Disclosure: Show simple data first, details on demand
- Empowerment Metrics: Focus on growth and improvement, not surveillance
- Reduce Complexity: Fewer clicks, clearer visualizations
- Actionable Insights: Every chart should answer "So what?" and "Now what?"
#Other Improvements
- Simplified Reports Page: Cleaner table, inline filters
- Simplified Kanban Board: Streamlined task management
- GitHub-style Heatmap: Proper days-as-rows, weeks-as-columns layout
- Responsive Design: All new components work great on different screen sizes
#Update Now
This update is available now! Your app will auto-update, or you can download the latest version from our website.
We'd love to hear what you think of the new Analytics Dashboard!
Have questions or feedback? Join our Discord community or reach out directly. Your input shapes the future of iTracksy!
Happy tracking!